After conducting 8 or more customer interviews, themes will start to bubble up.
But often, there are many more smaller nuances — or even surprises — that remain hidden and need to be unlocked.
To mine these gold nuggets, there can be an enormous amount of effort that goes into prepping qualitative, or unstructured, data. In most cases, I will spend a solid day (or more) getting the data ready for more careful scrutiny.
Unstructured data can come from:
- Open-ended questions in a survey
- One-on-one interviews
- Diary studies
- Field studies
- Usability studies
- Stakeholder workshops
- Brainstorm sessions
- Focus groups
- Customer service logs
Here are 4 ways I analyze unstructured data:
1. Put data into a spreadsheet
When I’m conducting lots of interviews or workshops, I paste the verbatim participant quotes into a spreadsheet. Each participant gets a row. Each interview question gets its own column.
To save myself a step, I sometimes type my interview notes directly into a spreadsheet (rather than in a Word document).
Now, I can easily sort, filter, and code the data.
2. Create word clouds
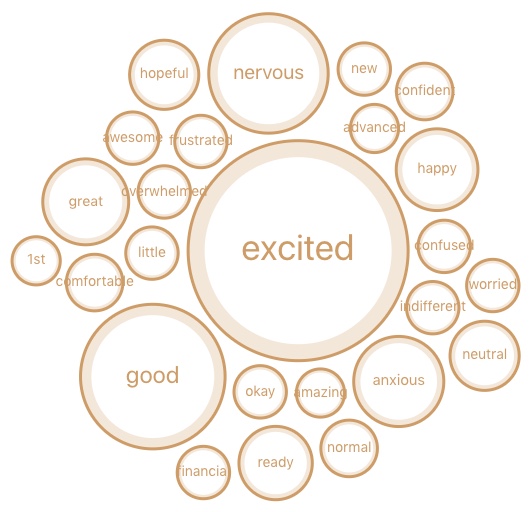
Before hand coding unstructured data, it can be enlightening to first use a word cloud tool. It’s easy to see which words pop using this tool and figure out which keywords to focus on when I return to my spreadsheet.
Prior to using the word cloud tool, I usually do additional data cleaning. For example, I will change supported, supportive, and support to all say “supportive,” and then run the raw text through the word cloud tool. Now, instead of splitting the vote 3 ways, the concept of “supportive” gets the attention it deserves.
A note of caution… a word cloud is an analysis tool, not analysis output. Creating a word cloud isn’t the end of the analysis. Why do people feel anxious? Amazing? Confused? Deeper work is needed to understand what’s really going on.
3. Create affinity maps using sticky notes
Sometimes the number of themes is too overwhelming to report in a meaningful way. Who wants to look at a bullet point list of 50 themes? No one.
When this happens, I’ll write each theme or idea onto a separate sticky note. Next, I arrange the stickies on a wall, and then group similar ideas together.
Now, I can roll up dozens of themes into 3 to 5 key takeaways and create a findings report with more impact.
4. Create a mind map
This is exactly the same method as No. 3, just digitized.
When I’m collecting hundreds of insights over a long period of time or across multiple studies for the same project, then this is my go-to method. As I go through my notes or participant verbatims, I add and organize new insights to a mind map.
My preferred mind mapping tool is MindMeister. What’s yours?
In Conclusion
When interviewing customers, be sure to build in extra time after each session to:
- Reflect.
- Clean up your notes.
- Conduct recap sessions with other observers.
- Capture your overall impressions about the participant.
- Take a photo of the participant (to keep all of them straight in your head).
These extra steps will help make analysis easier AND help create richer, more vibrant customer stories for the findings report.
Related Articles
- Discovering Hidden Insights with Kano Analysis: A Case Study
- ESAT & CSAT: A Survey Alignment Love Story
- UX Research Toolbox: Anatomy of a Compelling Narrative for Your UX Research Reports
- Data Overload? How to Manage the Flow of CX Insights Effectively
- Bias-Free UX Research: Innovative Approaches to Mitigating Bias in the Research Process