Customer problems erode your bottomline.
Chip away at them using a human-centered approach to design solutions, and then continually measure performance using CES (customer effort score).
If you’re not sure where or how to begin measuring the impact of design, I recommend starting with CES.
1) It’s easy to collect and track over time.
2) It predicts customer loyalty better than any other design metric.
When you look around your product or organization, there are likely customer problems everywhere. Big ones. Little ones. Hidden ones. And new ones popping up all the time.
Here are 4 tips to get you started:
1. Gather Customer Problems
CES measures customer problems. CES doesn’t identify customer problems.
If you don’t already know your customers’ problems, there are at least 16 ways to find them, including:
- Social listening
- Customer service logs
- Contextual inquiries
- Ethnography / field interviews
2. Winnow Customer Problems
Once you’ve gathered the majority of problems, next you’ll want to narrow them down to focus on just the ones that cause the most pain:
- Card sort. Ask customers to sort problems into pre-determined categories from a list of 30-40 problems. Categories might be level of severity (low, medium, high), frequency (rarely, sometimes, often), or importance (low, medium, high).
- Top problem analysis. Ask customers to choose their top 5 from a randomized list of 50-100 problems.
- Stakeholder interviews. Consult with your product team, UX researchers, and/or frontline employees to identify the top problems. A handy tool for this exercise is the Impact-Effort Matrix.
3. Focus on the Peak-End Rule
Ever hear of the “peak-end rule”? People generally only remember the most intense part of an experience and the very end of the experience. And not much else.
Think back to a recent vacation or flight. Which parts do you remember really well? Likely you best remember the best or worst part, and how it ended.
If it’s too overwhelming or difficult to measure every part of the customer experience—start out by measuring and tracking just the peaks and the end.
4. Create a Customer Problem Map
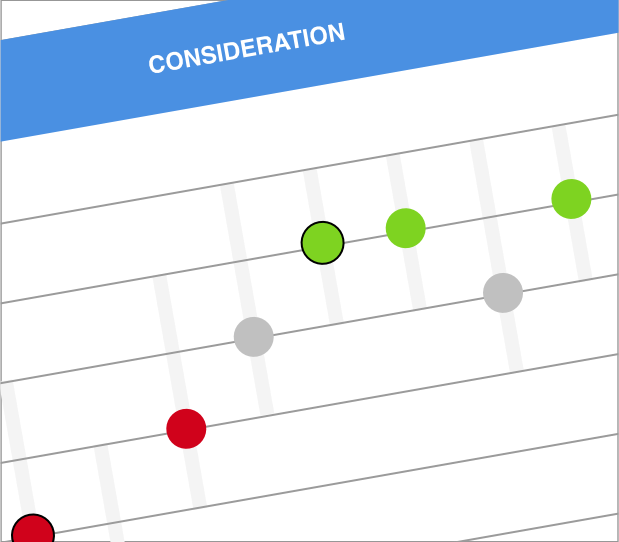
What the design team or leaders thought was a big customer problem might actually be overshadowed by something else.
Map the CES score (color) and frequency (outline) of customer problems on your customer journey map. Visualizing—and giving context to—your customer problems on a map will help design teams quickly zero in on which ones require immediate TLC.
To go the extra mile, benchmark how well your competitors solve these same problems (indicated by the gray bars).
Related Articles
- Can Empathy Be Measured?
- 4 Tips for Measuring Customer Problems
- Can Design Be Measured? Design Metrics for Data-Driven Organizations
- How to Tie CX to Revenue
- Redesigning Your Analytics Dashboard: Categorize Dashboard Interview Findings into Themes