Next Friday morning, I will be speaking at the Nonprofit Communicators Workshop: “Overcoming Analysis Paralysis.”
Note: This workshop took place Dec. 13, 2013.
In this workshop, my co-presenter Kate Borman and I will be helping nonprofits develop an analytics framework, then provide practical advice on how to set up, manage and analyze a campaign using Google Analytics and other tracking tools. Kate is the communications coordinator at Nonprofits Assistance Fund, an organization that helps other nonprofits become more financially healthy.
Slide Deck: Overcoming Analysis Paralysis
First, Set Yourself Up for Success
One of the topics we’ll be covering is how to set yourself up for success. Whenever I work with a new client or take on a new project, I always begin with the end in mind. What is it that you want to accomplish? What does success look like?
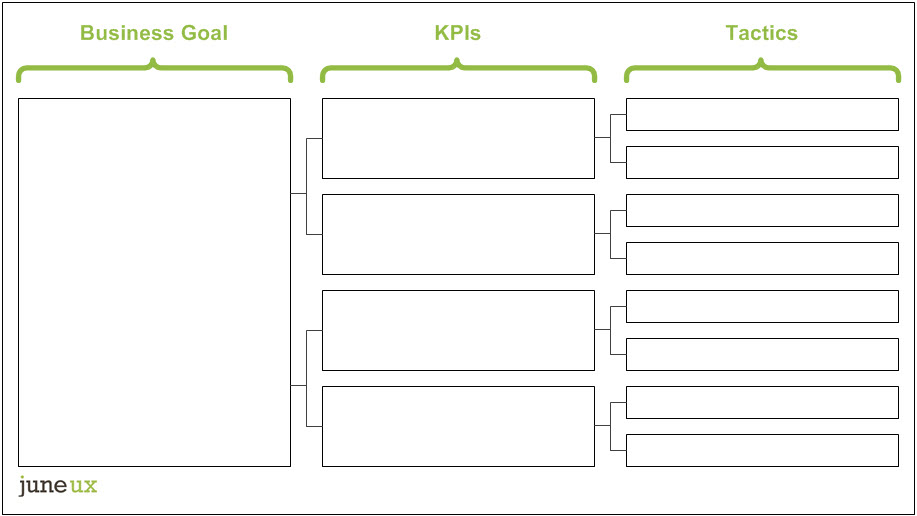
Over the years, I’ve developed a simple worksheet that I use to help companies think strategically about their goals. I call it a “ladder.” (I know it doesn’t look like one, but stay with me.)
Ladder Diagram Worksheet
If you haven’t already done so, first define your SMART business objectives:
Specific
Measureable
Attainable
Relevant
Time-Bound Goals
Add a new row for each business objective.
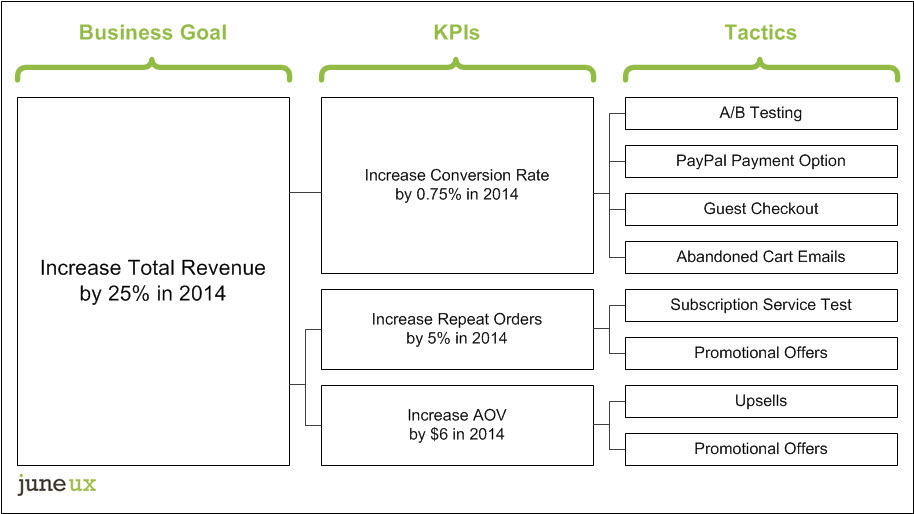
Next, define and “ladder up” your KPIs and tactics to these high-level goals. Also a good idea: confirm that the math works (i.e., your KPIs “add up” to equal your business objectives).
Finally, make sure there is someone held accountable for each and every KPI.
In the ladder diagram below, I show example KPIs and tactics that ladder up to a SMART business objective. This example is obviously web-specific, but the ideal ladder diagram should include both online and offline strategic goals. If you work within a large organization, add a fourth column to segment by business unit or function.
Ladder Diagram Example
By mapping your business objectives, KPIs and tactics in this way, several things happen all at once:
- Easier to focus on what’s most important & clear away distractions
- Easier to prioritize
- Easier to set budgets & defend them
- Easier to ward off non-strategic projects (“shiny objects”)
- Easier to structure your performance dashboard(s)
If you haven’t defined goals this way before and aren’t sure how to set relevant goals, you have a couple options.
1) Take your best guess, then re-evaluate after a few weeks or months. Were you way under or way over? Adjust accordingly. To avoid frustrating the rest of your organization in the interim, be sure to wait to communicate the new KPIs until they are firmed up and signed off by all parties.
2) Use industry benchmarks to establish your goals. Depending on your need, there are numerous tools available — free and paid — that can help you see how your conversion rate, rich media click-through rate, or SEM spend compares within your industry. One benchmarking tool I frequently use is Compete.com.
What Else Will Be in the Workshop?
In addition to explaining the ladder concept, Kate and I will:
- Go into more depth about what makes a good KPI vs. a “bad” KPI
- Show how to dig deeper in your analysis, and go beyond superficial metrics such as page views or bounce rates
- Teach you how to design an actionable dashboard that efficiently communicates results and drives change
- Share the key tasks to complete before, during and after every campaign
- Provide a list of recommended tracking tools
- Share campaign monitoring best practices
Related Articles
Redesign Your Web Analytics Dashboard for Better Insights
How to Identify Actionable Business Insights

